


Basic use
Ultra-short cheat sheet:
from datamatrix import DataMatrix
# Create a new DataMatrix
dm = DataMatrix(length=5)
# The first two rows
print(dm[:2])
# Create a new column and initialize it with the Fibonacci series
dm.fibonacci = 0, 1, 1, 2, 3
# A simple selection (remove 0 and 2)
dm = (dm.fibonacci != 0) & (dm.fibonacci != 2)
# The first two cells from the fibonacci column
print(dm.fibonacci[:2])
# Column mean
print('Mean: %s' % dm.fibonacci.mean)
# Multiply all fibonacci cells by 2
dm.fibonacci_times_two = dm.fibonacci * 2
# Loop through all rows
for row in dm:
    print(row.fibonacci) # get the fibonacci cell from the row
# Loop through all columns
for colname, col in dm.columns:
    for cell in col: # Loop through all cells in the column
        print(cell) # do something with the cell
Slightly longer cheat sheet:
Basic operations
Creating a DataMatrix
Create a new DataMatrix object, and add a column (named col). By default, the column is of the MixedColumn type, which can store numeric and string data.
from datamatrix import DataMatrix, __version__
dm = DataMatrix(length=2)
dm.col = ':-)'
print('These examples were generated with DataMatrix v%s\n' % __version__)
print(dm)
Output:
These examples were generated with DataMatrix v0.3.8

+---+-----+
| # | col |
+---+-----+
| 0 | :-) |
| 1 | :-) |
+---+-----+
You can change the length of the DataMatrix later on. If you reduce the length, data will be lost. If you increase the length, empty cells will be added.
dm.length = 3
Concatenating two DataMatrix objects
You can concatenate two DataMatrix objects using the << operator. Matching columns will be combined. (Note that row 2 is empty. This is because we have increased the length of dm in the previous step, causing an empty row to be added.)
dm2 = DataMatrix(length=2)
dm2.col = ';-)'
dm2.col2 = 10, 20
dm3 = dm << dm2
print(dm3)
Output:
+---+-----+------+
| # | col | col2 |
+---+-----+------+
| 0 | :-) |      |
| 1 | :-) |      |
| 2 |     |      |
| 3 | ;-) |  10  |
| 4 | ;-) |  20  |
+---+-----+------+
Creating columns
You can change all cells in column to a single value. This creates a new column if it doesn't exist yet.
dm.col = 'Another value'
print(dm)
Output:
+---+---------------+
| # |      col      |
+---+---------------+
| 0 | Another value |
| 1 | Another value |
| 2 | Another value |
+---+---------------+
You can change all cells in a column based on a sequence. This creates a new column if it doesn't exist yet. This sequence must have the same length as the column (3 in this case).
dm.col = 1, 2, 3
print(dm)
Output:
+---+-----+
| # | col |
+---+-----+
| 0 |  1  |
| 1 |  2  |
| 2 |  3  |
+---+-----+
If you do not know the name of a column, for example becaues it is defined by a variable, you can also refer to columns as though they are items of a dict. However, this is not recommended, because it makes it less clear whether you are referring to column or a row.
dm['col'] = 'X'
print(dm)
Output:
+---+-----+
| # | col |
+---+-----+
| 0 |  X  |
| 1 |  X  |
| 2 |  X  |
+---+-----+
Renaming columns
dm.rename('col', 'col2')
print(dm)
Output:
+---+------+
| # | col2 |
+---+------+
| 0 |  X   |
| 1 |  X   |
| 2 |  X   |
+---+------+
Deleting columns
You can delete a column using the del keyword:
dm.col = 'x'
del dm.col2
print(dm)
Output:
+---+-----+
| # | col |
+---+-----+
| 0 |  x  |
| 1 |  x  |
| 2 |  x  |
+---+-----+
Changing column cells (and slicing)
Change one cell:
dm.col[1] = ':-)'
print(dm)
Output:
+---+-----+
| # | col |
+---+-----+
| 0 |  x  |
| 1 | :-) |
| 2 |  x  |
+---+-----+
Change multiple cells. (This changes row 0 and 2. It is not a slice!)
dm.col[0,2] = ':P'
print(dm)
Output:
+---+-----+
| # | col |
+---+-----+
| 0 |  :P |
| 1 | :-) |
| 2 |  :P |
+---+-----+
Change a slice of cells:
dm.col[1:] = ':D'
print(dm)
Output:
+---+-----+
| # | col |
+---+-----+
| 0 |  :P |
| 1 |  :D |
| 2 |  :D |
+---+-----+
Column properties
Basic numeric properties, such as the mean, can be accessed directly. Only numeric values are taken into account.
dm.col = 1, 2, 'not a number'
# Numeric descriptives
print('mean: %s' % dm.col.mean)
print('median: %s' % dm.col.median)
print('standard deviation: %s' % dm.col.std)
print('sum: %s' % dm.col.sum)
print('min: %s' % dm.col.min)
print('max: %s' % dm.col.max)
# Other properties
print('unique values: %s' % dm.col.unique)
print('number of unique values: %s' % dm.col.count)
print('column name: %s' % dm.col.name)
Output:
mean: 1.5
median: 1.5
standard deviation: 0.707106781187
sum: 3.0
min: 1.0
max: 2.0
unique values: [1, 2, u'not a number']
number of unique values: 3
column name: col
Iterating over rows, columns, and cells
By iterating directly over a DataMatrix object, you get successive Row objects. From a Row object, you can directly access cells.
dm.col = 'a', 'b', 'c'
for row in dm:
    print(row)
    print(row.col)
Output:
+------+-------+
| Name | Value |
+------+-------+
| col  |   a   |
+------+-------+
a
+------+-------+
| Name | Value |
+------+-------+
| col  |   b   |
+------+-------+
b
+------+-------+
| Name | Value |
+------+-------+
| col  |   c   |
+------+-------+
c
By iterating over DataMatrix.columns, you get successive (column_name, column) tuples.
for colname, col in dm.columns:
    print('%s = %s' % (colname, col))
Output:
col = col[u'a', u'b', u'c']
By iterating over a column, you get successive cells:
for cell in dm.col:
 print(cell)
Output:
a
b
c
By iterating over a Row object, you get (column_name, cell) tuples:
row = dm[0] # Get the first row
for colname, cell in row:
    print('%s = %s' % (colname, cell))
Output:
col = a
Selecting data
You can select by directly comparing columns to values. This returns a new DataMatrix object with only the selected rows.
dm = DataMatrix(length=10)
dm.col = range(10)
dm_subset = dm.col > 5
print(dm_subset)
Output:
+---+-----+
| # | col |
+---+-----+
| 6 |  6  |
| 7 |  7  |
| 8 |  8  |
| 9 |  9  |
+---+-----+
You can select by multiple criteria using the | (or), & (and), and ^ (xor) operators (but not the actual words 'and' and 'or'). Note the parentheses, which are necessary because | and & have priority over other operators.
dm_subset = (dm.col < 1) | (dm.col > 8)
print(dm_subset)
Output:
+---+-----+
| # | col |
+---+-----+
| 0 |  0  |
| 9 |  9  |
+---+-----+
dm_subset = (dm.col > 1) & (dm.col < 8)
print(dm_subset)
Output:
+---+-----+
| # | col |
+---+-----+
| 2 |  2  |
| 3 |  3  |
| 4 |  4  |
| 5 |  5  |
| 6 |  6  |
| 7 |  7  |
+---+-----+
Basic column operations (multiplication, addition, etc.)
You can apply basic mathematical operations on all cells in a column simultaneously. Cells with non-numeric values are ignored, except by the + operator, which then results in concatenation.
dm = DataMatrix(length=3)
dm.col = 0, 'a', 20
dm.col2 = dm.col*.5
dm.col3 = dm.col+10
dm.col4 = dm.col-10
dm.col5 = dm.col/50
print(dm)
Output:
+---+-----+------+------+------+------+
| # | col | col2 | col3 | col4 | col5 |
+---+-----+------+------+------+------+
| 0 |  0  | 0.0  |  10  | -10  | 0.0  |
| 1 |  a  |  a   | a10  |  a   |  a   |
| 2 |  20 | 10.0 |  30  |  10  | 0.4  |
+---+-----+------+------+------+------+
Working numeric data (requires numpy)
If you do not specify a column type (as in the examples above), the MixedColumn will be used. When you work with large amounts of numeric data, you can use the IntColumn or FloatColumn to improve performance. These columns are built on top of numpy arrays.
import numpy as np
from matplotlib import pyplot as plt
from datamatrix import IntColumn, FloatColumn

dm = DataMatrix(length=1000)
dm.x = IntColumn # Initialized with all 0 values
dm.x = np.arange(0, 1000)
dm.y = FloatColumn

dm.y = np.sin(np.linspace(0, 2*np.pi, 1000))
plt.plot(dm.x, dm.y)
plt.savefig('content/pages/img/basic/sinewave.png')
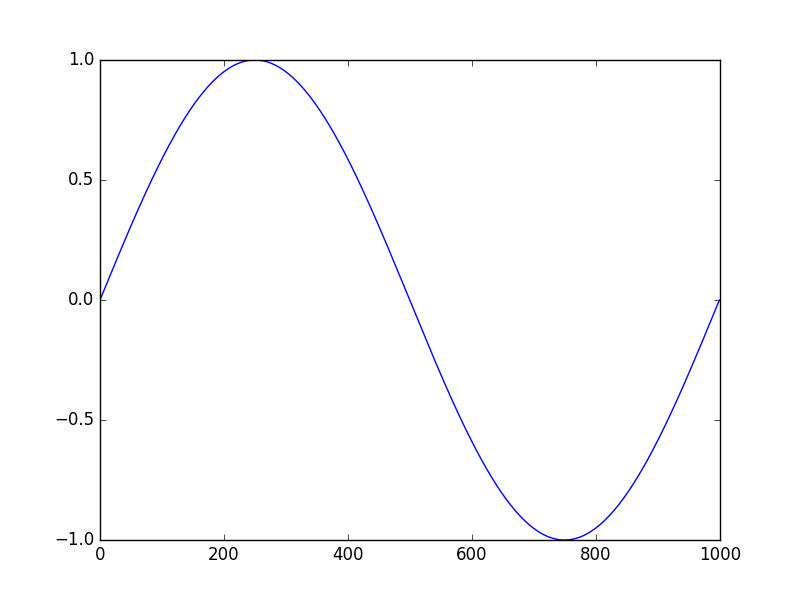
Figure 1.
Working with continuous data (requires numpy)
The SeriesColumn is 2 dimensional; that is, each cell is by itself an array of values. Therefore, the SeriesColumn can be used to work with sets of continuous data, such as EEG or eye-position traces.
For more information about series, see:
import numpy as np
from matplotlib import pyplot as plt
from datamatrix import SeriesColumn

length = 10 # Number of traces
depth = 50 # Size of each trace

x = np.linspace(0, 2*np.pi, depth)
sinewave = np.sin(x)
noise = np.random.random(depth)*2-1

dm = DataMatrix(length=length)
dm.series = SeriesColumn(depth=depth)
dm.series[0] = noise
dm.series[1:].setallrows(sinewave)
dm.series[1:] *= np.linspace(-1, 1, 9)

plt.xlim(x.min(), x.max())
plt.plot(x, dm.series.plottable, color='green', linestyle=':')
y1 = dm.series.mean-dm.series.std
y2 = dm.series.mean+dm.series.std
plt.fill_between(x, y1, y2, alpha=.2, color='blue')
plt.plot(x, dm.series.mean, color='blue')
plt.savefig('content/pages/img/basic/sinewave-series.png')
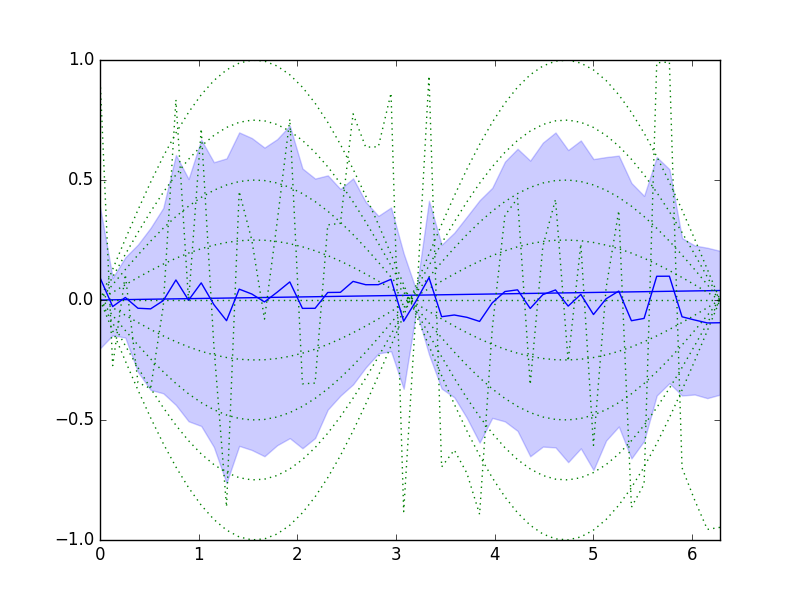
Figure 2.