


Plotting
Compatibility with Seaborn and Matplotlib
DataMatrix objects can be passed to most seaborn plotting functions as if they are pandas.DataFrame objects. Below are some examples of common plot types.
The example data1 below is from a behavioral experiment with a single dependent variable (RT_search) and two independent variables (condition and load).
from datamatrix import io
from matplotlib import pyplot as plt
import seaborn as sns

dm = io.readtxt('data/fratescu-replication-data-exp1.csv')
sns.set(style='darkgrid')
Point plot
Seaborn documentation:
plt.clf()
sns.pointplot(
    x='condition',
    y='RT_search',
    hue='load',
    order=['no', 'unrel', 'rel-mis', 'rel-match'],
    data=dm,
)
plt.xlabel('Distractor condition')
plt.ylabel('Reaction time (ms)')
plt.legend(title='Memory load')
plt.savefig('content/pages/img/plotting/pointplot.png')
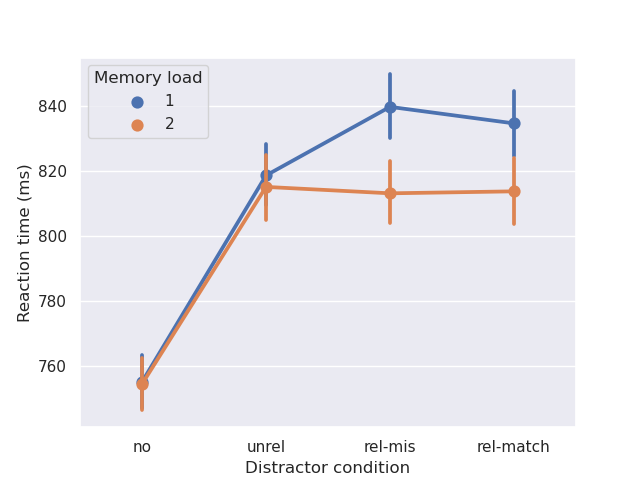
Figure 1.
Bar plot (sns.barplot)
Seaborn documentation:
plt.clf()
sns.barplot(
    x='condition',
    y='RT_search',
    hue='load',
    order=['no', 'unrel', 'rel-mis', 'rel-match'],
    data=dm,
)
plt.ylim(700, 900)
plt.xlabel('Distractor condition')
plt.ylabel('Reaction time (ms)')
plt.legend(title='Memory load')
plt.savefig('content/pages/img/plotting/barplot.png')
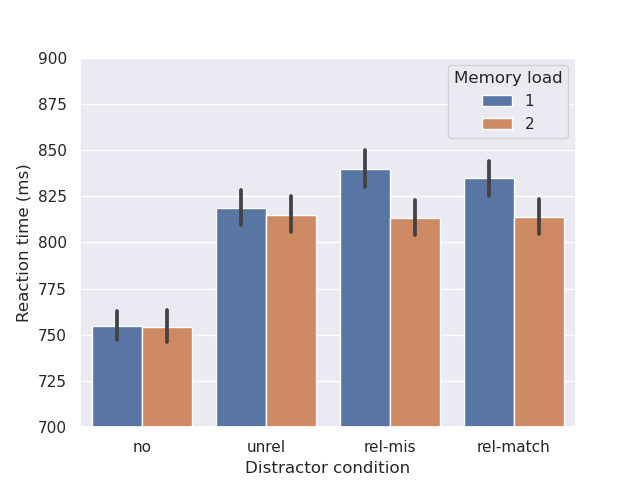
Figure 2.
Distribution plot (sns.distplot)
Seaborn documentation:
plt.clf()
sns.distplot(dm.RT_search)
plt.savefig('content/pages/img/plotting/distplot.png')
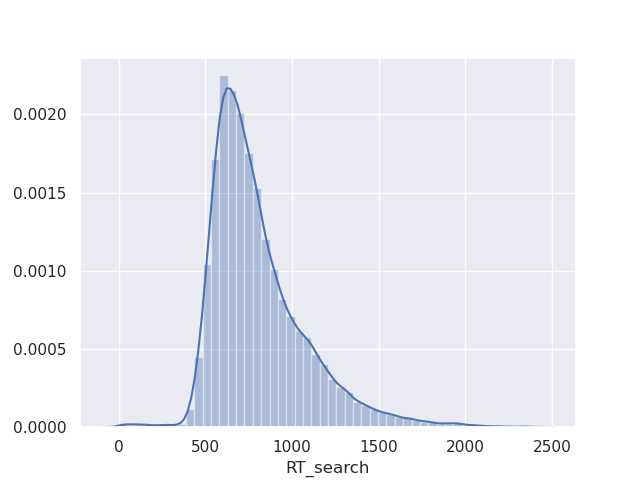
Figure 3.
-
The example data is adapted from Frătescu et al. (2018), Experiment 1. ↩